Multiple Choice
A shirt production company has tracked their sales of red and blue shirts over the past few years.The graph of both is shown below. 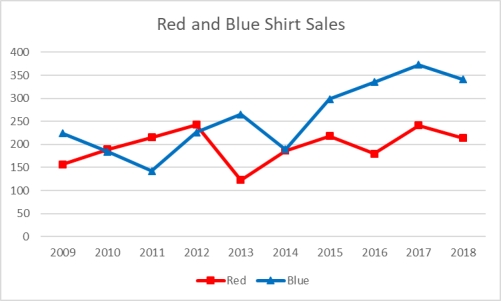 Which of the following is a true statement about the trends in sales?
A) Sales of red shirts are less than those of blue shirts in all the years before 2012.
B) Sales of blue shirts are trending upward from 2014 to 2017.
C) Sales of blue shirts are always higher than those of red shirts.
D) Red shirt sales show an increasing trend.
E) Sales of red shirts are always higher than those of blue shirts.
Correct Answer:

Verified
Correct Answer:
Verified
Q18: To consider historical data as part of
Q19: The staff of Mr.Wayne Wertz, VP of
Q22: Consider the following stem and leaf plot:
Q52: In a histogram,the tallest bar represents the
Q55: The number of phone calls arriving
Q58: A cumulative frequency polygon is also called
Q59: One advantage of a stem and leaf
Q79: Pinky Bauer, Chief Financial Officer of
Q81: If both variables being analyzed are nominal
Q93: A frequency distribution was developed.The lower endpoint