Multiple Choice
Sales are tracked during the past year in the graph below. 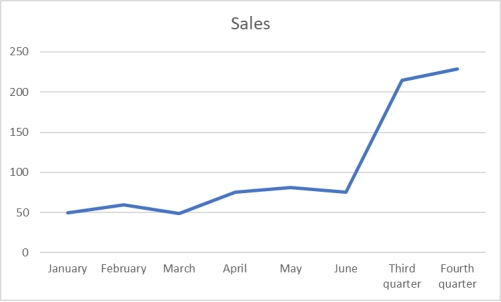 Management is pleased to see the growth in sales at the end of the year.Why would this be an incorrect conclusion?
A) The highest growth was in the month of June
B) Cannot compare sales for different time periods
C) The graph is not showing growth rates
D) A bar graph would be more effective in determining that conclusion
E) A second year of data would be needed to make that conclusion
Correct Answer:

Verified
Correct Answer:
Verified
Q1: The following represent the ages of students
Q2: A cross tabulation is a graph that
Q15: The following time-series data shows the
Q45: One rule that must always be followed
Q78: A person has decided to construct a
Q83: The staff of Mr.Wayne Wertz, VP of
Q84: When looking at a scatter plot, if
Q86: Consider the following stem and leaf plot:
Q92: Consider the following frequency distribution:
Q108: A graphical representation of a frequency distribution