Multiple Choice
Monthly sales were tracked and shown on the graph below. 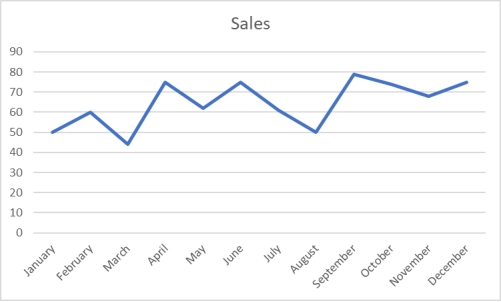 Which of the following would be an incorrect conclusion based on this graph?
A) Sales were lowest in the month of March.
B) Sales increased between August and September.
C) The last month had higher sales than the first month.
D) Sales declined from June through August.
E) The last month had higher sales than September.
Correct Answer:

Verified
Correct Answer:
Verified
Q2: According to the following graphic the most
Q3: Each day, the office staff at Oasis
Q7: The number of phone calls arriving
Q8: The staff of Mr.Wayne Wertz, VP of
Q9: Each day, the office staff at Oasis
Q10: Two other names for cross tabulations are
Q26: Consider the following frequency distribution:
Q61: Consider the relative frequency distribution given
Q82: For a company in gardening supplies business,the
Q91: Pinky Bauer, Chief Financial Officer of