Multiple Choice
Use the graph below to answer this question: Around what time did the patient reach the maximum beats per minute? 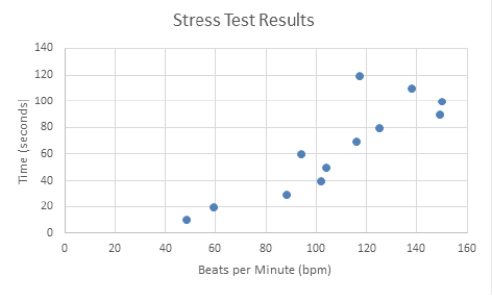
A) 60 seconds
B) 80 seconds
C) 100 seconds
D) 120 seconds
Correct Answer:

Verified
Correct Answer:
Verified
Related Questions
Q13: Which presentation type is NOT continuous?<br>A) Scatter
Q14: In a pie chart, all the slices
Q15: One feature that data analysts use frequently
Q16: Which of the following is a disadvantage
Q17: A coding supervisor has been trying to
Q19: Use the graph below to answer this
Q20: Which type of data representation is best
Q21: Which weight category in the chart below
Q22: Which type of data presentation method is
Q23: Which type of presentation method shows the