Essay
Figure: The Optimal Quantity
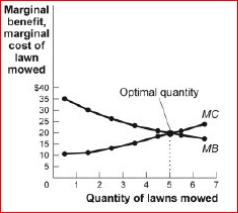
 (Figure: The Optimal Quantity) Look at the figure The Optimal Quantity.If the demand for
lawn-mowing decreased, the ________ curve in the figure would shift to the and the
optimal quantity would be five lawns mowed.
A.marginal benefit; right; more than
B.marginal cost; right; fewer than
C.marginal benefit; left; fewer than
D.marginal cost; left; more than
Correct Answer:

Verified
marginal b...View Answer
Unlock this answer now
Get Access to more Verified Answers free of charge
Correct Answer:
Verified
View Answer
Unlock this answer now
Get Access to more Verified Answers free of charge
Q4: If marginal costs remain constant,the marginal cost
Q26: If a decision maker chooses an option
Q34: <img src="https://d2lvgg3v3hfg70.cloudfront.net/TB1063/.jpg" alt=" (Table:
Q36: One of Jessuina's New Year's resolutions was
Q40: Whenever marginal benefit is greater than marginal
Q42: <img src="https://d2lvgg3v3hfg70.cloudfront.net/TB1063/.jpg" alt=" (Table: The Cost
Q43: Which of the following is an example
Q103: Which of the following is a systematic
Q143: Economic profits can be negative,even if accounting
Q183: The tendency to avoid making a decision