Essay
Figure: The Optimal Quantity
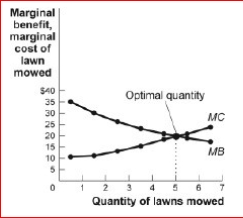
 (Figure: The Optimal Quantity) Look at the figure The Optimal Quantity.If the cost of producing
lawn-mowing decreased, the ________ curve in the figure would shift to the and the total
net gain would _.
A.marginal benefit; right; increase
B.marginal cost; right; increase
C.marginal benefit; left; decrease
D.marginal cost; left; decrease
Correct Answer:

Verified
marginal c...View Answer
Unlock this answer now
Get Access to more Verified Answers free of charge
Correct Answer:
Verified
View Answer
Unlock this answer now
Get Access to more Verified Answers free of charge
Q4: If marginal costs remain constant,the marginal cost
Q21: Profit computed using explicit costs as the
Q26: Wendy sells ice-making machines.She can sell six
Q28: If marginal costs of production are greater
Q31: Scenario: Betty's Cookie Shop<br>Betty runs a cookie
Q34: <img src="https://d2lvgg3v3hfg70.cloudfront.net/TB1063/.jpg" alt=" (Table:
Q35: Because resources are scarce,the true cost of
Q115: Learning effects often result in _ marginal
Q149: Money that must be paid for the
Q154: Suppose Joan buys a new refrigerator to