Essay
Figure: The Optimal Quantity
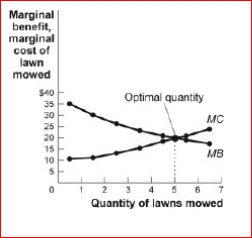
 (Figure: The Optimal Quantity) Look at the figure The Optimal Quantity.If the cost of producing lawn-mowing increased, the ________ curve in the figure would shift to the and the total
net gain would _.
A.marginal benefit; right; increase
B.marginal cost; right; increase
C.marginal benefit; left; decrease
D.marginal cost; left; decrease
Correct Answer:

Verified
marginal c...View Answer
Unlock this answer now
Get Access to more Verified Answers free of charge
Correct Answer:
Verified
View Answer
Unlock this answer now
Get Access to more Verified Answers free of charge
Q4: You and a friend have each spent
Q5: Constant marginal costs occur when each individual
Q8: Figure: Marginal Benefits and Marginal Costs<br> <img
Q12: While eating pizza, you discover that the
Q13: When a decision maker makes a choice
Q14: Part of the associated with the Chicago
Q39: Since they have already paid for their
Q53: The amount by which an additional unit
Q136: For which of the following decisions would
Q174: If the marginal benefit received from a