Essay
Figure: The Marginal Analysis of Cell Phones
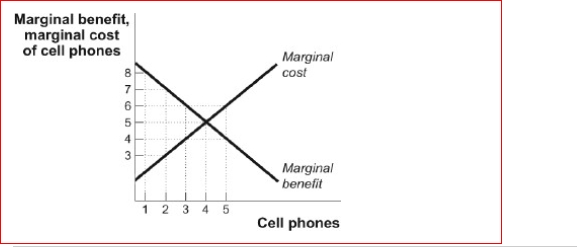 (Figure: The Marginal Analysis of Cell Phones) Look at the figure The Marginal Analysis of Cell Phones.You are considering purchasing cell phones for your department.The graph represents your marginal benefit and marginal cost curves.If you consume the fifth cell phone, your net change in total benefit will be equal to:
A.$0.
B.-$2.
C.$2.
D.$4.
Correct Answer:

Verified
Correct Answer:
Verified
Q51: Which of the following is an "either-or"
Q65: Suppose a local floral shop has explicit
Q66: To determine the quantity of any activity
Q68: Economists' and psychologists' attempts to understand and
Q71: Costs that are included in the economic
Q72: <img src="https://d2lvgg3v3hfg70.cloudfront.net/TB1063/.jpg" alt=" (Table: TC's Pizza
Q74: When a decision maker makes a quick
Q75: If the marginal benefit received from a
Q151: Profit is the difference between _ and
Q181: During its only year of operation,a firm