Multiple Choice
Figure: The Demand Curve for Oil 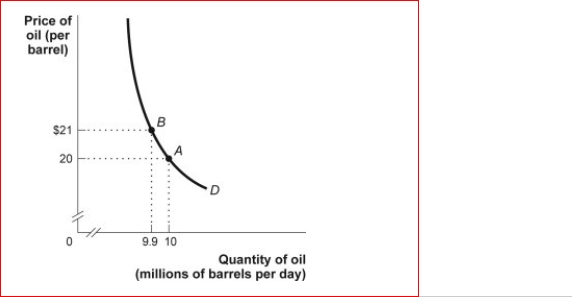 (Figure: Demand Curve for Oil) Look at the figure The Demand Curve for Oil.The price elasticity of demand between $20 and $21, using the midpoint method, is approximately:
A) 0.21.
B) 0.49.
C) 2.1.
D) 4.9.
Correct Answer:

Verified
Correct Answer:
Verified
Q47: Suppose the price of real estate increases
Q98: Suppose the cross-price elasticity between two goods
Q109: The cross-price elasticity of electricity with respect
Q117: Table: Price Elasticity<br>(Table: Price Elasticity) Look again
Q118: A price ceiling will cause a larger
Q120: The price elasticity of a good will
Q121: The demand for strawberry ice cream tends
Q123: Suppose at a price of $10 the
Q124: A shirt manufacturer sold 10 dozen shirts
Q225: If the cross-price elasticity of demand between