Multiple Choice
Figure: The Demand Curve for Crossings 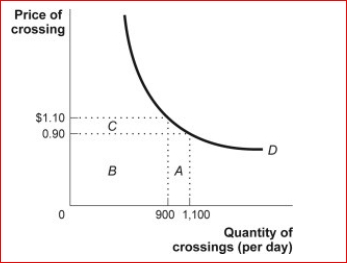
 (Figure: The Demand Curve for Crossings) Look at the figure The Demand Curve for Crossings.This graph examines the demand for crossing a bridge over a very large river.Using the midpoint method, the price elasticity of demand between $0.90 and $1.10 is approximately:
A) 0.1.
B) 0.2.
C) 1.
D) 1.9.
Correct Answer:

Verified
Correct Answer:
Verified
Q5: If the price of chocolate-covered peanuts decreases
Q6: It is very difficult for Julia to
Q11: Suppose the cross-price elasticity between demand for
Q13: The price elasticity of demand for gasoline
Q14: The price elasticity of demand is the
Q15: Sonik, a local wireless phone company, tested
Q67: If an increase in the price of
Q149: The price elasticity of demand for a
Q190: The income elasticity of demand of a
Q201: The pair of items that is likely