Multiple Choice
Figure: The Demand Curve 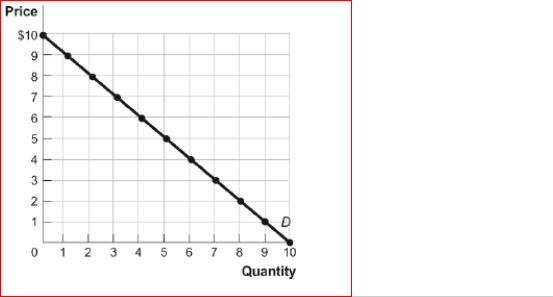 (Figure: The Demand Curve) Look at the figure The Demand Curve.Using the midpoint method, the price elasticity of demand between $8 and $9 is approximately:
A) 0.18.
B) 0.56.
C) 1.8.
D) 5.67.
Correct Answer:

Verified
Correct Answer:
Verified
Q2: Local cable companies recently increased the price
Q70: <img src="https://d2lvgg3v3hfg70.cloudfront.net/TB1063/.jpg" alt=" (Table:
Q71: (Table: Johnson's Income and Expenditures) Look at
Q72: The demand for agricultural output is price
Q73: There is no total revenue test for
Q75: Figure: The Demand for e-Books<br>(Figure: The Demand
Q76: Figure: The Demand Curve<br>(Figure: The Demand Curve)
Q77: All of the following are characteristics of
Q78: Consider the market for strawberries.Which of the
Q87: An important determinant of the price elasticity