Multiple Choice
Figure: The Demand Curve 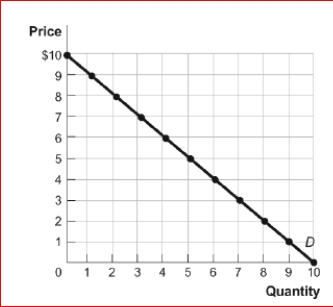
 (Figure: The Demand Curve) Look again at the figure The Demand Curve.Using the midpoint method, the price elasticity of demand between $6 and $7 is approximately:
A) 0.19.
B) 1.
C) 1.86.
D) 5.4.
Correct Answer:

Verified
Correct Answer:
Verified
Q8: If your income increases and your consumption
Q68: Suppose that an increase in the price
Q137: When Joe's income is $100 per week,
Q138: Figure: The Demand for Shirts<br> <img src="https://d2lvgg3v3hfg70.cloudfront.net/TB1063/.jpg"
Q139: The price elasticity of demand measures the:<br>A.responsiveness
Q140: The ratio of the percentage change in
Q142: The price elasticity of demand for fresh
Q143: Figure: The Demand for Shirts<br> <img src="https://d2lvgg3v3hfg70.cloudfront.net/TB1063/.jpg"
Q192: When the price of chocolate-covered peanuts increases
Q223: If the price elasticity of demand between