Essay
Figure: The Demand Curve
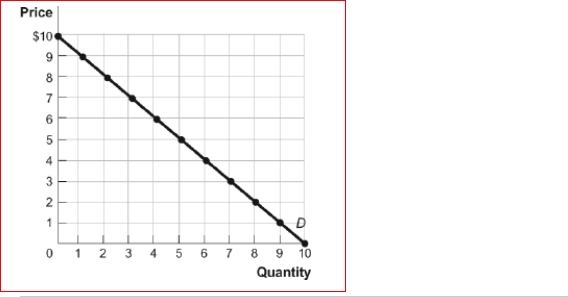 (Figure: The Demand Curve) Between the prices of $4 and $5, demand is , and total
revenue will if price increases.
A.elastic; increase
B.elastic; decrease
C.inelastic; increase
D.inelastic; decrease
Correct Answer:

Verified
Correct Answer:
Verified
Related Questions
Q140: If total revenue goes up when the
Q185: If a good is a luxury item
Q186: There is one gas station in a
Q187: Assume the price elasticity of demand for
Q188: If the income elasticity of demand for
Q189: (Table: Prices, Quantity Demanded, and Income for
Q191: An attorney supplies 40 hours of work
Q192: (Table: Johnson's Income and Expenditures) Look again
Q193: If the estimated price elasticity of demand
Q195: The price elasticity of supply for a