Essay
Figure: The Demand Curve for Oil
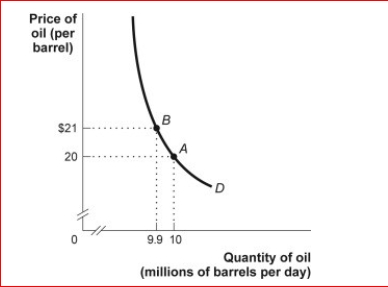
 (Figure: The Demand Curve for Oil) Look at the figure The Demand Curve for Oil.In the figure, the price elasticity of demand between $20 and $21 is:
A.price-elastic, since the price elasticity is less than 1.
B.price unit-elastic, since the price elasticity is equal to 1.
C.price-elastic, since the price elasticity is a negative number.
D.price-inelastic, since the price elasticity is less than 1.
Correct Answer:

Verified
price-inelastic, sin...View Answer
Unlock this answer now
Get Access to more Verified Answers free of charge
Correct Answer:
Verified
View Answer
Unlock this answer now
Get Access to more Verified Answers free of charge
Q61: The cross-price elasticity of demand of substitute
Q100: Which of the following goods is likely
Q110: The price of coffee increases by 10%,and
Q113: The demand for textbooks is price-inelastic. Which
Q119: A demand curve that is perfectly inelastic
Q207: If a change in price causes total
Q209: Egg producers know that the elasticity of
Q216: On a linear demand curve, the price
Q222: Figure: The Demand Curve<br> <img src="https://d2lvgg3v3hfg70.cloudfront.net/TB1063/.jpg" alt="Figure:
Q224: Determining the price elasticity of demand involves