Essay
Figure: The Demand Curve for Oil
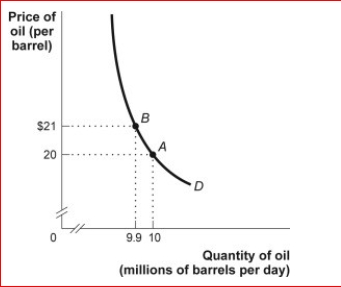
 (Figure: The Demand Curve for Oil) Look at the figure The Demand Curve for Oil.In the figure, demand is price ________ between $20 and $21, since total revenue when
the price _.
A.elastic; increases; decreases
B.inelastic; stays the same; decreases
C.elastic; decreases; increases
D.inelastic; increases; increases
Correct Answer:

Verified
inelastic;...View Answer
Unlock this answer now
Get Access to more Verified Answers free of charge
Correct Answer:
Verified
View Answer
Unlock this answer now
Get Access to more Verified Answers free of charge
Q20: <img src="https://d2lvgg3v3hfg70.cloudfront.net/TB1063/.jpg" alt=" (Table:
Q21: A men's tie store sold an average
Q23: Sometimes airlines raise ticket prices as the
Q27: Figure: Supply Curves<br>(Figure: Supply Curves) Look at
Q28: If two goods are complements, their cross-price
Q28: If two goods are complements, their cross-price
Q29: Figure: The Demand for Shirts <img src="https://d2lvgg3v3hfg70.cloudfront.net/TB1063/.jpg"
Q57: The price elasticity of the supply of
Q139: Given a price increase for any good,the
Q238: If the price of chocolate-covered peanuts increases