Essay
Figure: The Demand Curve for Bridge Crossings
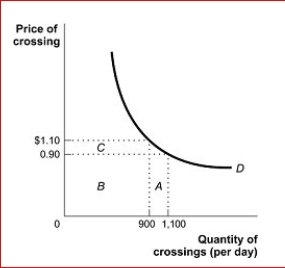
 (Figure: The Demand Curve for Bridge Crossings) Look at the figure The Demand Curve for Bridge Crossings.The price elasticity of demand between $0.90 and $1.10 in the figure is:
A.price-elastic, since the price elasticity is less than 1.
B.price unit-elastic, since the price elasticity is equal to 1.
C.price-elastic, since the price elasticity is a negative number.
D.price-inelastic, since the price elasticity is less than 1.
Correct Answer:

Verified
price unit-elastic, ...View Answer
Unlock this answer now
Get Access to more Verified Answers free of charge
Correct Answer:
Verified
View Answer
Unlock this answer now
Get Access to more Verified Answers free of charge
Q64: One would expect to see the supply
Q87: Figure: The Demand for Shirts <img src="https://d2lvgg3v3hfg70.cloudfront.net/TB1063/.jpg"
Q88: Which of the following statements is true?<br>A.When
Q89: Figure: Supply Curves <img src="https://d2lvgg3v3hfg70.cloudfront.net/TB1063/.jpg" alt="Figure: Supply
Q91: If the price elasticity of supply is
Q93: Suppose the price of cereal rose by
Q94: When actually calculated for a normal demand
Q95: The publisher of an economics textbook finds
Q96: Figure: The Market for e-Books<br>(Figure: The Market
Q97: Using the midpoint method to calculate the