Essay
Figure: The Demand Curve for Bridge Crossings
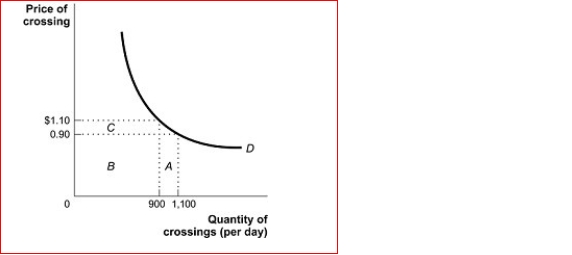 (Figure: The Demand Curve for Bridge Crossings) Look again at the figure The Demand Curve for Bridge Crossings.Demand is price between $0.90 and $1.10, since total
revenue ________ when the price _.
A.elastic; increases; decreases
B.inelastic; stays the same; decreases
C.unit-elastic; stays the same; increases
D.inelastic; increases; increases
Correct Answer:

Verified
unit-elast...View Answer
Unlock this answer now
Get Access to more Verified Answers free of charge
Correct Answer:
Verified
View Answer
Unlock this answer now
Get Access to more Verified Answers free of charge
Q64: If an increase in income leads to
Q104: The director of River City Public Transport
Q153: If the price of chocolate-covered peanuts decreases
Q154: After you graduate from college, you open
Q155: Figure: Demand Curves <img src="https://d2lvgg3v3hfg70.cloudfront.net/TB1063/.jpg" alt="Figure: Demand
Q156: A major state university in the South
Q157: Table: Price Elasticity<br>(Table: Price Elasticity) Look again
Q160: The cross-price elasticity of demand for Coke
Q161: The price elasticity of demand for skiing
Q162: If the price of chocolate-covered peanuts decreases