Essay
Figure: The Linear Demand Curve
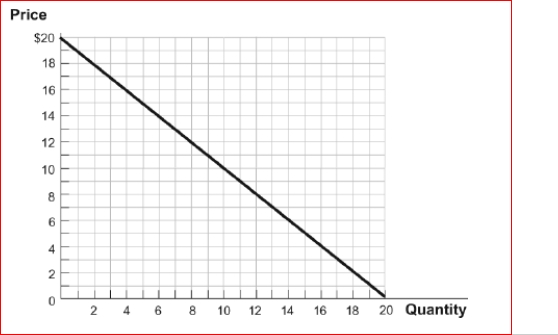 (Figure: The Linear Demand Curve) Look at the figure The Linear Demand Curve.If the price is initially $10, then falls to $9, this will result in a(n):
A.decrease in quantity demanded and a decrease in total revenue.
B.decrease in quantity demanded and an increase in total revenue.
C.increase in quantity demanded and a decrease in total revenue.
D.increase in quantity demanded and an increase in total revenue.
Correct Answer:

Verified
increase in quantity...View Answer
Unlock this answer now
Get Access to more Verified Answers free of charge
Correct Answer:
Verified
View Answer
Unlock this answer now
Get Access to more Verified Answers free of charge
Q24: The long-run price elasticity of supply of
Q31: Tomas produces 100 cartons of free range
Q106: When the price of chocolate-covered peanuts increases
Q163: If the cross-price elasticity of demand between
Q202: The income elasticity of demand for eggs
Q203: The price elasticity of demand for milk
Q204: Table: Price Elasticity<br>(Table: Price Elasticity) Look again
Q211: Which of the following statements is true?<br>A.If
Q212: If the price of emergency visits to
Q283: If the quantity supplied responds substantially to