Essay
Figure: Supply and Demand in Agriculture
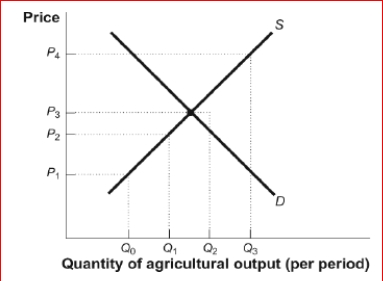
 (Figure: Supply and Demand in Agriculture) Look at the figure Supply and Demand in Agriculture.If the equilibrium price for wheat is as shown in the graph, how could the government help increase farmers' income?
A.A price floor could be set at P₄, causing a surplus of Q₃ - Q0.
B.A price floor could be set at P₂, causing a surplus of Q₂ - Q0.
C.A price ceiling could be set at P₄, causing a surplus of Q₂ - Q₁.
D.A price floor could be set at P₁, causing a shortage of Q₃ - Q0.
Correct Answer:

Verified
A price floor could ...View Answer
Unlock this answer now
Get Access to more Verified Answers free of charge
Correct Answer:
Verified
View Answer
Unlock this answer now
Get Access to more Verified Answers free of charge
Q140: The government decides to impose a price
Q193: Figure: The Shrimp Market<br>(Figure: The Shrimp Market)
Q194: Figure: Market I<br>(Figure: Market I) Look at
Q195: Figure: Rent Controls<br>(Figure: Rent Controls) Look at
Q195: Inefficient allocations of goods to consumers often
Q196: Figure: The Market for Hotel Rooms<br>(Figure: The
Q197: Suppose the U.S.government imposes a binding quota
Q201: Figure: The Market for Round-Trip Airline Flights
Q202: If the government feels that the price
Q203: Figure: Supply and Demand<br>(Figure: Supply and Demand)