Multiple Choice
Figure: Gain in Consumer Surplus 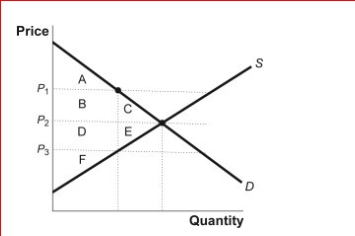
 (Figure: Gain in Consumer Surplus) Look at the figure Gain in Consumer Surplus.Identify the area or areas that represent the gain in consumer surplus to consumers already participating in the market when the price falls from P₁ to P₂.
A) A and B
B) B
C) B and C
D) C
Correct Answer:

Verified
Correct Answer:
Verified
Q58: Christine has a linear demand curve for
Q59: Figure: Consumer and Producer Surplus<br>(Figure: Consumer and
Q60: If the price is below the equilibrium
Q61: The total producer surplus in the Wisconsin
Q62: Suppose the market demand curve for TV
Q64: Figure: The Market for Books<br> <img src="https://d2lvgg3v3hfg70.cloudfront.net/TB1063/.jpg"
Q65: Along a given supply curve, a decrease
Q66: Figure: The Market for Hamburgers<br> <img src="https://d2lvgg3v3hfg70.cloudfront.net/TB1063/.jpg"
Q67: (Table: Quantity Supplied and Quantity Demanded) Look
Q68: Producer surplus for an individual seller is