Essay
Figure: Change in the Total Surplus
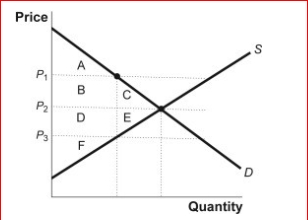
 (Figure: Change in Total Surplus) Look at the figure Change in the Total Surplus.Which of the following areas represent the change in total surplus when the price falls from P₂ to P₃?
A.A, B, and C
B.B and C
C.B, C, D, and E
D.C and E
Correct Answer:

Verified
Correct Answer:
Verified
Q31: Mark and Rasheed are at the bookstore
Q46: Figure: Demand for Cincinnati Reds Games Tickets<br>
Q47: Figure: Wireless Mouse Market<br>(Figure: Wireless Mouse Market)
Q48: When a market is efficient:<br>A.there is no
Q50: Figure: Consumer Surplus I<br> <img src="https://d2lvgg3v3hfg70.cloudfront.net/TB1063/.jpg" alt="Figure:
Q53: Which of the following is true when
Q54: (Table: Willingness to Pay for Peanuts) Look
Q55: Figure: The Wireless Mouse Market<br> <img src="https://d2lvgg3v3hfg70.cloudfront.net/TB1063/.jpg"
Q56: Figure: Producer Surplus III<br> <img src="https://d2lvgg3v3hfg70.cloudfront.net/TB1063/.jpg" alt="Figure:
Q156: A consumer's willingness to pay for a