Multiple Choice
Figure: Market Failure 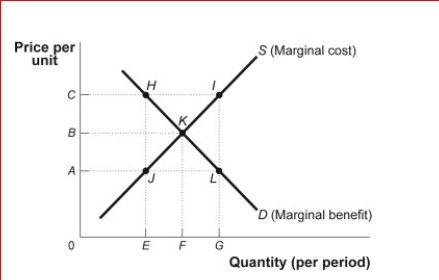
 (Figure: Market Failure) Look at the figure Market Failure.Suppose the supply curve represents the marginal cost of providing street lights in a neighborhood that is composed of two people, Ann and Joe.The demand curve represents the marginal benefit that Ann receives from the street lights.Suppose that Joe's marginal benefit from the street lights is a constant amount equal to AC.How much is Ann willing to pay for F street lights?
A) 0
B) A
C) B
D) C
Correct Answer:

Verified
Correct Answer:
Verified
Q14: <img src="https://d2lvgg3v3hfg70.cloudfront.net/TB1063/.jpg" alt=" (Table:
Q15: (Table: Marginal Benefit, Cost, and Consumer Surplus)
Q16: The free-rider problem refers to:<br>A)the situation in
Q17: Goods are said to be "rival in
Q18: A good that is nonexcludable but rival
Q20: In the United Kingdom, most television programming
Q22: Since individuals ignore the effect their use
Q23: Suppose the small town of Falls Valley
Q68: The free-rider problem is a direct result
Q157: If a good has a marginal cost