Multiple Choice
Figure: Market Failure 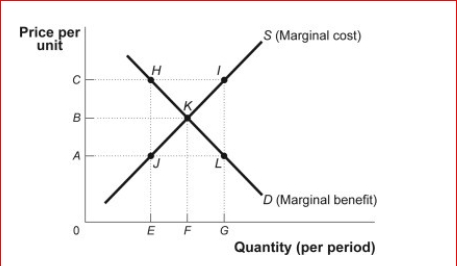
 (Figure: Market Failure) Look at the figure Market Failure.Suppose the supply curve represents the marginal cost of providing street lights in a neighborhood that is composed of two people, Ann and Joe.The demand curve represents the marginal benefit that Ann receives from the street lights.Suppose that Joe's marginal benefit from the street lights is a constant amount equal to AC.The marginal social benefit of F street lights is
A) 0
B) B
C) less than B
D) greater than B
Correct Answer:

Verified
Correct Answer:
Verified
Q39: A movie DVD is a private good,
Q41: Colleges and universities solicit their alumni for
Q65: If the marginal benefit received from a
Q73: A(n)_ is nonexcludable and nonrival in consumption.<br>A)private
Q78: The best example of a private good
Q109: Most neighborhood streets are illuminated at night
Q110: Figure: Model of a Market for a
Q113: Figure: Market Failure <img src="https://d2lvgg3v3hfg70.cloudfront.net/TB1063/.jpg" alt="Figure: Market
Q119: When a good is nonexcludable:<br>A)consumers will pay
Q144: National defense and clean air are similar