Multiple Choice
Figure: Market Failure 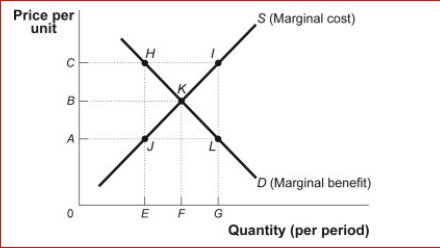
 (Figure: Market Failure) Look at the figure Market Failure.Suppose it represents the demand and marginal cost of pounds of shrimp in the bay.The additional cost of the shrimp due to the depletion of the common resource is equal to AC.At output F:
A) too much shrimp is being produced.
B) not enough shrimp is being produced.
C) the efficient amount of shrimp is being produced.
D) the socially optimum amount of shrimp is being produced.
Correct Answer:

Verified
Correct Answer:
Verified
Q43: Figure: Market Failure <img src="https://d2lvgg3v3hfg70.cloudfront.net/TB1063/.jpg" alt="Figure: Market
Q44: DeVonda owns a music store.One night, vandals
Q45: For a nonexcludable good like national defense,
Q46: Figure: Market Failure<br>(Figure: Market Failure) Look at
Q48: Which of the following is an example
Q50: The best example of a common resource
Q51: If policy makers provide only enough tradable
Q52: Figure: Market Failure<br>(Figure: Market Failure) Look at
Q155: Volunteer fire departments are good examples of
Q165: Which of the following goods is most