Multiple Choice
Figure: Efficiency and Pollution 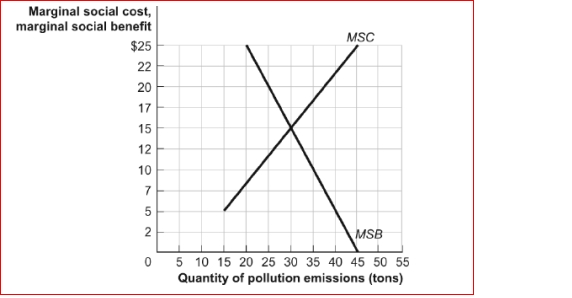 (Figure: Efficiency and Pollution) Look at the figure Efficiency and Pollution.The socially optimal quantity of pollution is:
A) 0 tons.
B) 20 tons.
C) 30 tons.
D) 45 tons.
Correct Answer:

Verified
Correct Answer:
Verified
Q4: Figure: Efficiency and Pollution <img src="https://d2lvgg3v3hfg70.cloudfront.net/TB1063/.jpg" alt="Figure:
Q5: Figure: Efficiency and Pollution <img src="https://d2lvgg3v3hfg70.cloudfront.net/TB1063/.jpg" alt="Figure:
Q7: Figure: Negative Externalities and Raising Pigs for
Q10: If the marginal benefit received from pollution
Q11: The marginal social benefit of pollution is
Q13: An emissions tax will:<br>A)ensure that the marginal
Q17: The marginal benefit from pollution _ as
Q97: Pigouvian taxes:<br>A)tax the profits of polluting firms.<br>B)are
Q105: When the government attempts to reduce the
Q185: When tradable emissions permits are used, if