Essay
Figure: Demand, Revenue, and Cost Curves
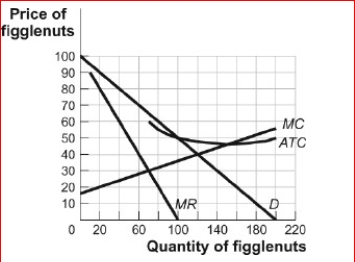
 (Figure: Demand, Revenue, and Cost Curves) Look at the figure Demand, Revenue, and Cost Curves.The figure shows the demand, marginal revenue, marginal cost, and average total cost curves for Figglenuts-R-Us, a monopolist in the figglenut market.Figglenuts-R-Us will sell
________ figglenuts and set a price of to maximize profits.
A.70; $65
B.100; $50
C.120; $40
D.150; $46
Correct Answer:

Verified
Correct Answer:
Verified
Q68: Figure: The Monopolist<br> <img src="https://d2lvgg3v3hfg70.cloudfront.net/TB1063/.jpg" alt="Figure: The
Q70: Figure: A Rock Climbing Shoe Monopoly <img
Q72: Figure: A Profit-Maximizing Monopoly Firm<br> <img src="https://d2lvgg3v3hfg70.cloudfront.net/TB1063/.jpg"
Q76: Figure: Short-Run Monopoly<br>(Figure: Short-Run Monopoly) Look at
Q77: Scenario: Monopolist<br>The demand curve for a monopolist
Q118: A monopoly's short-run supply curve is upward
Q136: The demand curve facing a monopolist is:<br>A)downward
Q185: If a firm wants to charge different
Q209: When a firm finds that its ATC
Q212: A natural monopoly has small fixed costs,