Multiple Choice
Figure: Demand, Revenue, and Cost Curves 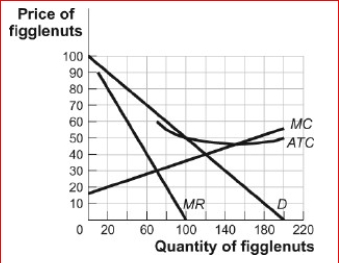
 (Figure: Demand, Revenue, and Cost Curves) Look at the figure Demand, Revenue, and Cost Curves.The figure shows the demand, marginal revenue, marginal cost, and average total cost curves for Figglenuts-R-Us, a monopolist in the figglenut market.If the government wanted to regulate Figglenuts-R-Us such that it would minimize the deadweight loss while allowing the firm to break even, it would impose a price ceiling of in the market.
A) $40
B) $46
C) $50
D) $65
Correct Answer:

Verified
Correct Answer:
Verified
Q8: Which of the following is true?<br>A)A monopoly
Q11: Figure: The Monopolist III<br>(Figure: The Monopolist III)
Q12: Mr.Porter sells 10 bottles of champagne per
Q14: The pricing in monopoly prevents some mutually
Q15: The land you own has the only
Q16: (Table: Demand for Economics Tutoring) Look at
Q18: Temporary monopolies via the provision of sole
Q18: Which of the following is not an
Q50: Explain why the marginal revenue curve lies
Q303: When regulating a natural monopoly,the government always