Essay
Figure: Demand, Revenue, and Cost Curves
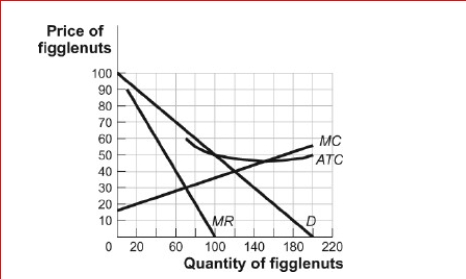
 (Figure: Demand, Revenue, and Cost Curves) Look at the figure Demand, Revenue, and Cost Curves.The figure shows the demand, marginal revenue, marginal cost, and average total cost curves for Figglenuts-R-Us, a monopolist in the figglenut market.If the government regulated the figglenut market by setting a price ceiling of $40, Figglenuts-R-Us might:
A.produce 60 figglenuts to maximize profit.
B.produce 120 figglenuts to maximize profit.
C.shut down in the short run.
D.increase the price to $60.
Correct Answer:

Verified
shut down ...View Answer
Unlock this answer now
Get Access to more Verified Answers free of charge
Correct Answer:
Verified
View Answer
Unlock this answer now
Get Access to more Verified Answers free of charge
Q102: The demand curve for a monopoly is:<br>A)the
Q105: The monopoly firm's profit-maximizing price is:<br>A.given by
Q107: Figure: A Rock Climbing Shoe Monopoly<br> <img
Q108: (Table: Demand for Economics Tutoring) Look at
Q109: The main reason a monopoly engages in
Q111: A monopoly can be temporary because of:<br>A)high
Q112: Figure: Short-Run Monopoly <img src="https://d2lvgg3v3hfg70.cloudfront.net/TB1063/.jpg" alt="Figure: Short-Run
Q113: (Table: Prices and Demand) Look at the
Q113: The marginal revenue curve for a monopolist
Q162: A natural monopoly exists when:<br>A)a few firms