Multiple Choice
Figure and Table: Variable, Fixed, and Total Costs 
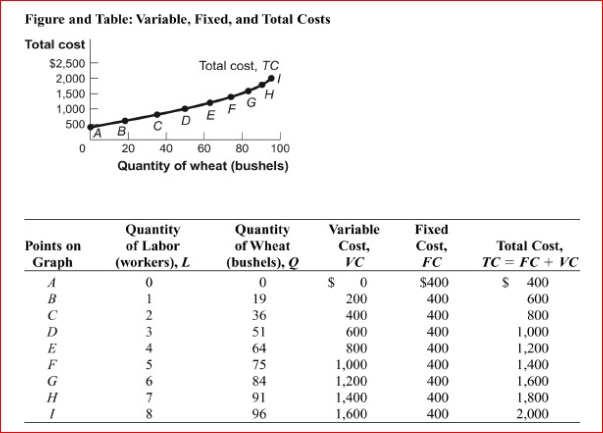 (Figure and Table: Variable, Fixed, and Total Costs) Look at the figure and table Variable, Fixed, and Total Costs.In the figure, when 51 bushels of wheat is produced, the average fixed cost is ,
Average variable cost is ________, and average total cost is _.
A) $7.84; $11.76; $19.60
B) $133.33; $200; $333.33
C) $400; $600; $1,000
D) $5.33; $13.33; $18.67
Correct Answer:

Verified
Correct Answer:
Verified
Q37: Figure: The Average Total Cost Curve<br>(Figure: The
Q38: When Caroline's dress factory hires two workers,
Q39: The idea of diminishing returns to an
Q41: Figure: The Total Product<br>(Figure: The Total Product)
Q43: In the long run, every input available
Q44: The level of inputs will determine a
Q45: As defined in the text, the long
Q106: Suppose a short-run production function always increases
Q132: Ashley Bakery expects its marginal cost curve
Q218: In the long run:<br>A) the firm considers