Multiple Choice
Figure: Long-Run and Short-Run Average Cost Curves 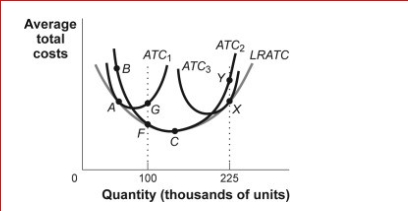
 (Figure:Long-Run and Short-Run Average Cost Curves ) Look at the figure Long-Run and Short-Run Average Cost Curves.If a firm is producing at point C on the ATC2 but anticipates increasing output to 225,000 units in the long run, the firm will build a ________ plant and have _.
A) smaller; economies of scale
B) smaller; diseconomies of scale
C) bigger; economies of scale
D) bigger; diseconomies of scale
Correct Answer:

Verified
Correct Answer:
Verified
Q68: Total cost divided by the quantity of
Q89: <img src="https://d2lvgg3v3hfg70.cloudfront.net/TB1063/.jpg" alt=" (Table:
Q89: The curve that shows the additional cost
Q90: Janet's poodle grooming salon has a total
Q91: When an increase in the firm's output
Q92: The curve that shows the additional cost
Q93: When a firm produces a small amount
Q96: <img src="https://d2lvgg3v3hfg70.cloudfront.net/TB1063/.jpg" alt=" (Table:
Q99: Diminishing marginal returns occur when:<br>A)each additional unit
Q196: If marginal cost is greater than average