Essay
Figure: Tom's Production Possibilities
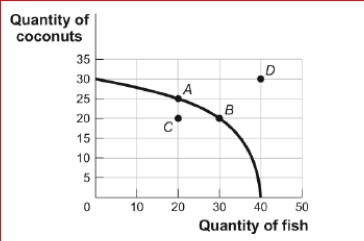
 (Figure: Tom's Production Possibilities) Look at the figure Tom's Production Possibilities.In the figure, the opportunity cost for Tom to move from point A on the curve to point B is:
A.10 coconuts.
B.10 fish.
C.5 coconuts.
D.5 fish.
Correct Answer:

Verified
Correct Answer:
Verified
Q16: If the opportunity cost of manufacturing automobiles
Q19: An economy is said to have a
Q57: An economy is said to have a
Q59: Which of the following is an example
Q60: Economists may disagree about policies because:<br>A.they may
Q62: Which of the following two statements is
Q63: (Table: Production Possibilities Schedule I) Look at
Q65: Efficient production exists when the economy is:<br>A.operating
Q66: Figure: Production Possibility Frontier<br>(Figure: Production Possibility Frontier)
Q68: Figure: Comparative Advantage<br>Eastland and Westland produce only