Essay
Figure: Production Possibilities and Circular-Flow Diagram
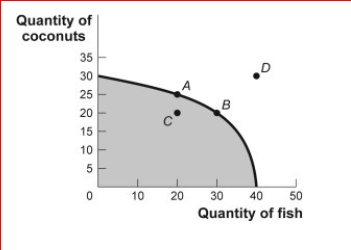
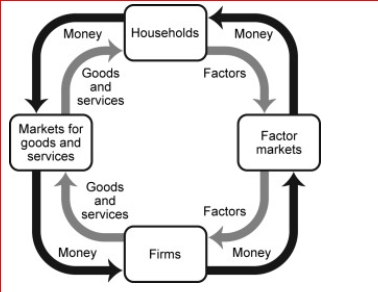
 (Figure: Production Possibilities and Circular-Flow Diagram) Look at the figure Production Possibilities and Circular-Flow Diagram.Assume the two figures represent the same economy.Suppose that in the circular-flow diagram there is a significant decrease in the amount of labor flowing to the firms that produce coconuts.If all other variables remain unchanged, this adjustment in the economy would be best represented in the production possibilities figure by a move from point A toward:
A.point A (no movement would occur).
B.point B (an increase in fish production).
C.point C (a decrease in coconut production).
D.point D (an outward shift of the entire curve).
Correct Answer:

Verified
point C (a...View Answer
Unlock this answer now
Get Access to more Verified Answers free of charge
Correct Answer:
Verified
View Answer
Unlock this answer now
Get Access to more Verified Answers free of charge
Q1: Economists generally believe that a country should
Q2: Bangladesh produces much of the clothing we
Q3: Figure: Tom's Production Possibilities<br> <img src="https://d2lvgg3v3hfg70.cloudfront.net/TB1063/.jpg" alt="Figure:
Q6: (Table: Production of Good Z and Good
Q7: Alexander has a straight-line, or linear, production
Q8: Figure: Consumer and Capital Goods<br> <img src="https://d2lvgg3v3hfg70.cloudfront.net/TB1063/.jpg"
Q10: Figure: Guns and Butter<br>(Figure: Guns and Butter)
Q64: If an economy is producing a level
Q177: The concept of comparative advantage is based
Q224: Technological improvements will:<br>A)leave the production possibility frontier