Essay
Figure: Production Possibilities and Circular-Flow Diagram
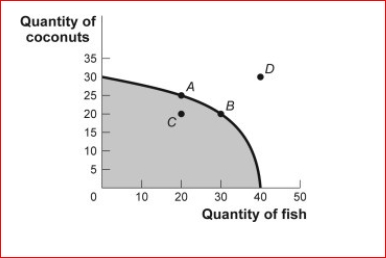
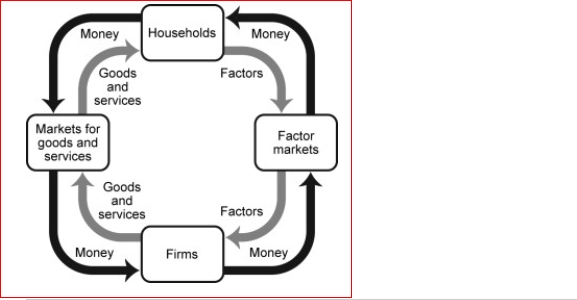 (Figure: Production Possibilities and Circular-Flow Diagram) Look at the figure Production Possibilities and Circular-Flow Diagram.Assume the two figures represent the same economy.Suppose that in the circular-flow diagram there is a significant increase in the amount of human capital that flows to both types of firms (coconut producers and fish producers).If all other variables remain unchanged, then the adjustment in this economy would be best represented in the production possibilities figure by a movement from point A toward:
A.point A (no movement would occur).
B.point B (an increase in fish production).
C.point C (a decrease in coconut production).
D.point D (an outward shift of the entire curve).
Correct Answer:

Verified
point D (a...View Answer
Unlock this answer now
Get Access to more Verified Answers free of charge
Correct Answer:
Verified
View Answer
Unlock this answer now
Get Access to more Verified Answers free of charge
Q210: Suppose Indiana produces only steel and corn,
Q211: Explain how technological progress is a source
Q212: Which of the following is a normative
Q213: An example of a positive statement is:<br>A.the
Q214: Figure: Tom's Production Possibilities<br>(Figure: Tom's Production Possibilities)
Q216: If they spend all night writing computer
Q217: Figure: Tom's Production Possibilities<br>(Figure: Tom's Production Possibilities)
Q218: The process observed when an economy's production
Q219: <img src="https://d2lvgg3v3hfg70.cloudfront.net/TB1063/.jpg" alt=" (Table:
Q220: Fertilizer, used to grow pumpkins, is an