Multiple Choice
For the equilibrium A2(g)  2A(g) , if a sample of A2(g) is placed in a sealed container and allowed to come to equilibrium, which graph best represents the relationship between Qc and time as equilibrium is established?
A) 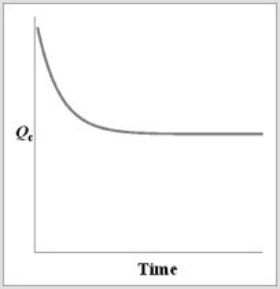
B) 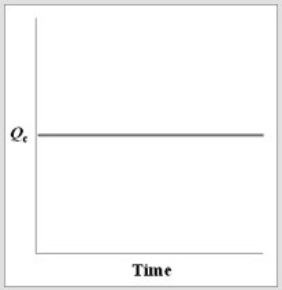
C) 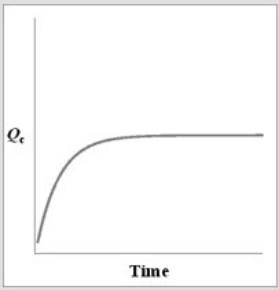
D) 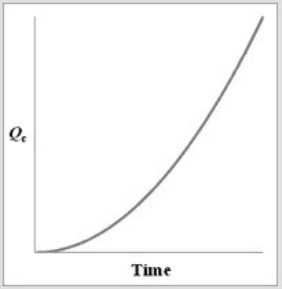
E) 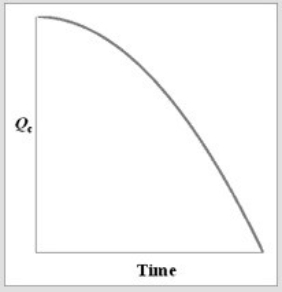
Correct Answer:

Verified
Correct Answer:
Verified
Q83: Increasing the temperature of an exothermic reaction
Q84: The equilibrium constant expression for the reaction<br>CuO(s)
Q85: Consider the equilibrium equation C(s) + O<sub>2</sub>(g)
Q86: Consider the chemical reaction 2NH<sub>3</sub>(g) <img src="https://d2lvgg3v3hfg70.cloudfront.net/TB8482/.jpg"
Q87: Consider the reversible reaction: 2NO<sub>2</sub>(g) <img src="https://d2lvgg3v3hfg70.cloudfront.net/TB8482/.jpg"
Q89: Which statement is correct?<br>A) When Q <
Q90: For the following reaction at equilibrium in
Q91: The formation constant for the reaction Ag<sup>+</sup>(aq)
Q92: At a certain temperature the reaction CO<sub>2</sub>(g)
Q93: Which substances are included in the equilibrium