Multiple Choice
For the equilibrium A2(g)  2A(g) , if a sample of A2(g) is placed in a sealed container and allowed to come to equilibrium, which graph best represents the relationship between Kc and time as equilibrium is established?
A) 
B) 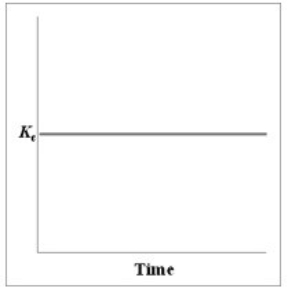
C) 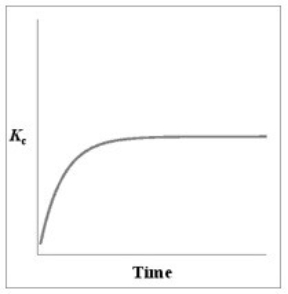
D) 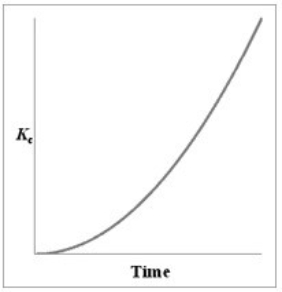
E) 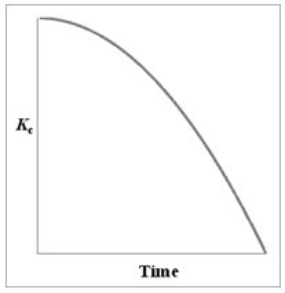
Correct Answer:

Verified
Correct Answer:
Verified
Q21: 5.00 mol of ammonia are introduced into
Q22: Phosgene, COCl<sub>2</sub>, a poisonous gas, decomposes as
Q23: Nitrosyl chloride (NOCl) decomposes at elevated temperatures
Q24: For the reaction 2X(g) + Y(g) <img
Q25: During a chemical reaction, what defines when
Q27: Hydrogen iodide decomposes according to the equation
Q28: Nitric oxide is formed in automobile exhaust
Q29: For the reaction 2NOCl(g) <img src="https://d2lvgg3v3hfg70.cloudfront.net/TB8482/.jpg" alt="For
Q30: For the nitrogen fixation reaction, 3H<sub>2</sub>(g) +
Q31: When a reaction reaches _, the concentration