Multiple Choice
The diagram below represents the final mixture corresponding to which chemical process? (Each sphere represents 1 mole of ions.) 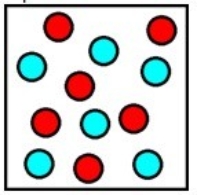
A) Six moles of sodium metal are added to six moles of hydrochloric acid.
B) Six moles of magnesium metal are added to six moles of hydrochloric acid.
C) Six moles of aluminum metal are added to twelve moles of hydrochloric acid.
D) Twelve moles of sodium metal are added to twelve moles of hydrochloric acid.
E) Twelve moles of magnesium metal are added to twelve moles of hydrochloric acid.
Correct Answer:

Verified
Correct Answer:
Verified
Q45: Based on the solubility rules, which of
Q46: A 0.8838-g sample of an ionic compound
Q47: If aqueous solutions of Na<sub>2</sub>CO<sub>3</sub> and BaCl<sub>2</sub>
Q48: Calcium nitrate tetrahydrate dissolves in warm water
Q49: What volume of a 0.442 M NaOH
Q51: A(n) _ _ is the name given
Q54: Which is a weak base?<br>A) NH<sub>3</sub><br>B) Ca(OH)<sub>2</sub><br>C)
Q55: What is the reducing agent in the
Q65: Which of these compounds is a strong
Q118: Identify the major ions present in an