Multiple Choice
TABLE 2-3
Every spring semester, the School of Business coordinates a luncheon with local business leaders for graduating seniors, their families, and friends. Corporate sponsorship pays for the lunches of each of the seniors, but students have to purchase tickets to cover the cost of lunches served to guests they bring with them. The following histogram represents the attendance at the senior luncheon, where X is the number of guests each graduating senior invited to the luncheon and f is the number of graduating seniors in each category.
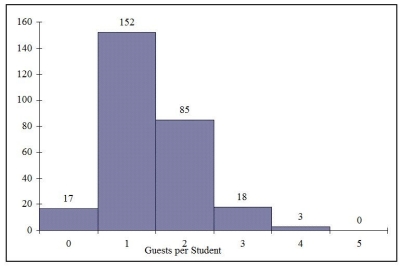
-Referring to the histogram from Table 2-3, how many graduating seniors attended the luncheon?
A) 4
B) 152
C) 275
D) 388
Correct Answer:

Verified
Correct Answer:
Verified
Q71: TABLE 2-11<br>The ordered array below resulted from
Q72: You have collected information on the market
Q73: TABLE 2-14<br>The table below contains the number
Q74: TABLE 2-13<br>Given below is the stem-and-leaf display
Q75: TABLE 2-14<br>The table below contains the number
Q77: TABLE 2-11<br>The ordered array below resulted from
Q78: TABLE 2-8<br>The Stem-and-Leaf display represents the number
Q80: TABLE 2-5<br>The following are the duration in
Q81: TABLE 2-12<br>The table below contains the opinions
Q138: The percentage distribution cannot be constructed from