Multiple Choice
TABLE 2-16
The figure below is the percentage polygon for the amount of calories for a sample of 36 pizzas products where the upper limits of the intervals are: 310, 340, 370, 400 and 430.
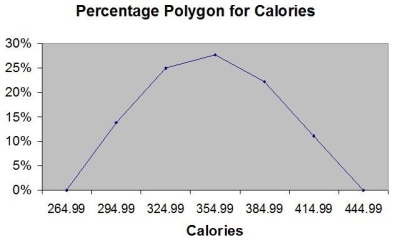
-Referring to Table 2-16, roughly what percentage of pizza products contains at least 340 calories?
A) 25%
B) 28%
C) 39%
D) 61%
Correct Answer:

Verified
Correct Answer:
Verified
Q10: In graphing two categorical data,the side-by-side bar
Q58: The main principle behind the Pareto chart
Q63: One of the developing countries is experiencing
Q178: You have collected data on the responses
Q194: TABLE 2-14<br>The table below contains the number
Q196: TABLE 2-7<br>The Stem-and-Leaf display below contains data
Q198: TABLE 2-12<br>The table below contains the opinions
Q202: TABLE 2-10<br>The histogram below represents scores achieved
Q203: TABLE 2-14<br>The table below contains the number
Q204: TABLE 2-8<br>The Stem-and-Leaf display represents the number