True/False
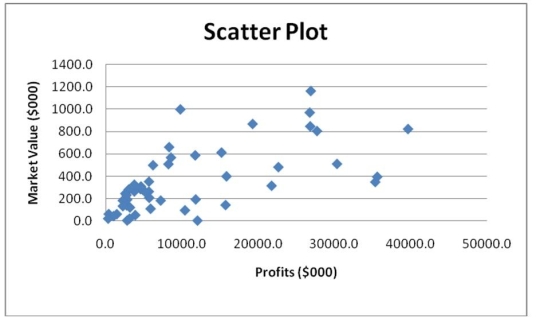
Given below is the scatter plot of the market value (thousands$)and profit (thousands$)of 50 U.S. companies. There appears to be a negative relationship between market value and profit.
Correct Answer:

Verified
Correct Answer:
Verified
Q5: TABLE 2-10<br>The histogram below represents scores achieved
Q10: TABLE 2-7<br>The Stem-and-Leaf display below contains data
Q13: Apple Computer, Inc. collected information on the
Q43: TABLE 2-9<br>The frequency distribution below represents the
Q96: TABLE 2-18<br>The stem-and-leaf display below shows the
Q154: Which of the following is appropriate for
Q181: The personnel director at a large company
Q198: TABLE 2-12<br>The table below contains the opinions
Q207: TABLE 2-7<br>The Stem-and-Leaf display below contains data
Q210: TABLE 2-9<br>The frequency distribution below represents the