True/False
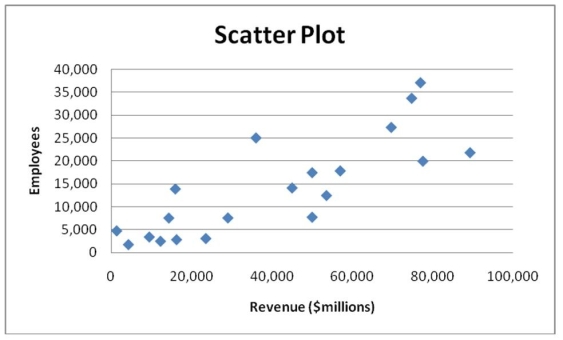
Given below is the scatter plot of the number of employees and the total revenue ($millions)of 20 U.S. companies. Companies that have higher numbers of employees appear to also have higher total revenue.
Correct Answer:

Verified
Correct Answer:
Verified
Related Questions
Q25: It is essential that each class grouping
Q64: TABLE 2-6<br>A sample of 200 students at
Q93: A_ is a vertical bar chart in
Q107: TABLE 2-17<br>The following table presents total retail
Q118: A histogram can have gaps between the
Q128: TABLE 2-10<br>The histogram below represents scores achieved
Q149: Relationships in a contingency table can be
Q154: A marketing research firm,in conducting a comparative
Q182: TABLE 2-6<br>A sample of 200 students at
Q202: TABLE 2-10<br>The histogram below represents scores achieved