Multiple Choice
TABLE 13-2
A candy bar manufacturer is interested in trying to estimate how sales are influenced by the price of their product. To do this, the company randomly chooses 6 small cities and offers the candy bar at different prices. Using candy bar sales as the dependent variable, the company will conduct a simple linear regression on the data below: 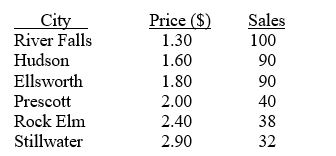
-Referring to Table 13-2, what is the percentage of the total variation in candy bar sales explained by the regression model?
A) 100%
B) 88.54%
C) 78.39%
D) 48.19%
Correct Answer:

Verified
Correct Answer:
Verified
Q6: If the Durbin-Watson statistic has a value
Q63: Which of the following assumptions concerning the
Q137: TABLE 13-10<br>The management of a chain electronic
Q139: TABLE 13-12<br>The manager of the purchasing department
Q140: TABLE 13-3<br>The director of cooperative education at
Q141: TABLE 13-10<br>The management of a chain electronic
Q143: TABLE 13-5<br>The managing partner of an advertising
Q144: Testing for the existence of correlation is
Q145: TABLE 13-3<br>The director of cooperative education at
Q146: TABLE 13-11<br>A computer software developer would like