Multiple Choice
TABLE 14-5
A microeconomist wants to determine how corporate sales are influenced by capital and wage spending by companies. She proceeds to randomly select 26 large corporations and record information in millions of dollars. The Microsoft Excel output below shows results of this multiple regression. 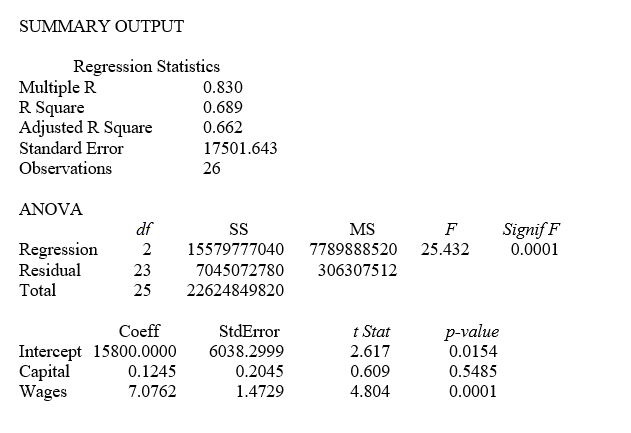
-Referring to Table 14-5, what fraction of the variability in sales is explained by spending on capital and wages?
A) 27.0%
B) 50.9%
C) 68.9%
D) 83.0%
Correct Answer:

Verified
Correct Answer:
Verified
Q173: A dummy variable is used as an
Q202: If a categorical independent variable contains 2
Q260: TABLE 14-15<br>The superintendent of a school district
Q261: TABLE 14-17<br> <img src="https://d2lvgg3v3hfg70.cloudfront.net/TB1602/.jpg" alt="TABLE 14-17
Q262: TABLE 14-13<br>An econometrician is interested in evaluating
Q263: TABLE 14-17<br> <img src="https://d2lvgg3v3hfg70.cloudfront.net/TB1602/.jpg" alt="TABLE 14-17
Q264: The coefficient of multiple determination r²Y.₁₂ measures
Q266: TABLE 14-10<br>You worked as an intern at
Q267: TABLE 14-16<br>What are the factors that determine
Q269: TABLE 14-16<br>What are the factors that determine