Multiple Choice
TABLE 14-5
A microeconomist wants to determine how corporate sales are influenced by capital and wage spending by companies. She proceeds to randomly select 26 large corporations and record information in millions of dollars. The Microsoft Excel output below shows results of this multiple regression. 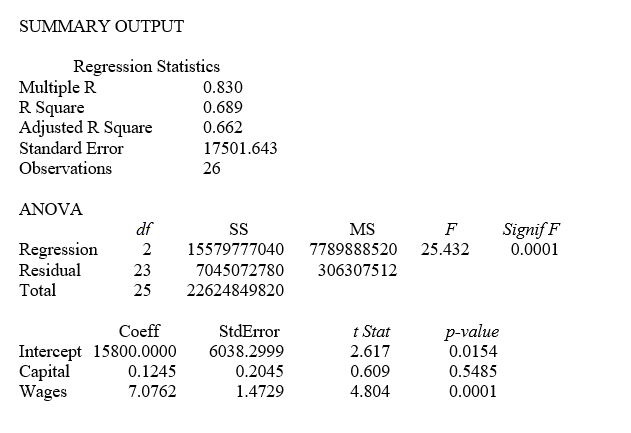
-Referring to Table 14-5, when the microeconomist used a simple linear regression model with sales as the dependent variable and wages as the independent variable, she obtained an r² value of 0.601. What additional percentage of the total variation of sales has been explained by including capital spending in the multiple regression?
A) 60.1%
B) 31.1%
C) 22.9%
D) 8.8%
Correct Answer:

Verified
Correct Answer:
Verified
Q104: TABLE 14-15<br>The superintendent of a school district
Q105: To explain personal consumption (CONS) measured in
Q106: TABLE 14-18<br>A logistic regression model was estimated
Q107: TABLE 14-19<br>The marketing manager for a nationally
Q108: TABLE 14-17<br> <img src="https://d2lvgg3v3hfg70.cloudfront.net/TB1602/.jpg" alt="TABLE 14-17
Q110: TABLE 14-15<br>The superintendent of a school district
Q111: TABLE 14-15<br>The superintendent of a school district
Q112: TABLE 14-16<br>What are the factors that determine
Q113: TABLE 14-4<br>A real estate builder wishes to
Q114: TABLE 14-16<br>What are the factors that determine