Essay
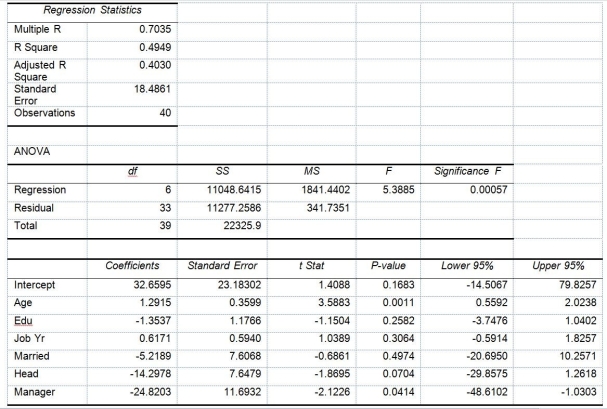
TABLE 14-17


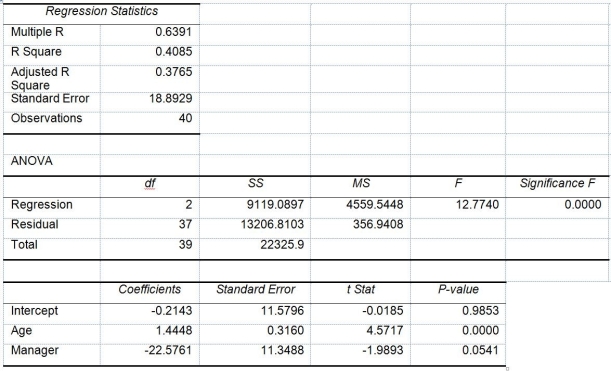
Model 2 is the regression analysis where the dependent variable is Unemploy and the independent variables are
Age and Manager. The results of the regression analysis are given below:

-Referring to Table 14-17 and using both Model 1 and Model 2, what is the p-value of the test statistic for testing whether the independent variables that are not significant individually are also not significant as a group in explaining the variation in the dependent variable at a 5% level of significance?
Correct Answer:

Verified
0.2518 or ...View Answer
Unlock this answer now
Get Access to more Verified Answers free of charge
Correct Answer:
Verified
View Answer
Unlock this answer now
Get Access to more Verified Answers free of charge
Q276: TABLE 14-3<br>An economist is interested to see
Q277: TABLE 14-19<br>The marketing manager for a nationally
Q278: TABLE 14-16<br>What are the factors that determine
Q279: TABLE 14-17<br> <img src="https://d2lvgg3v3hfg70.cloudfront.net/TB1602/.jpg" alt="TABLE 14-17
Q280: TABLE 14-9<br>You decide to predict gasoline prices
Q282: TABLE 14-10<br>You worked as an intern at
Q283: TABLE 14-19<br>The marketing manager for a nationally
Q284: TABLE 14-19<br>The marketing manager for a nationally
Q285: TABLE 14-7<br>The department head of the accounting
Q286: TABLE 14-18<br>A logistic regression model was estimated