Multiple Choice
TABLE 17-4
A factory supervisor is concerned that the time it takes workers to complete an important production task (measured in seconds) is too erratic and adversely affects expected profits. The supervisor proceeds by randomly sampling 5 individuals per hour for a period of 10 hours. The sample mean and range for each hour are listed below.
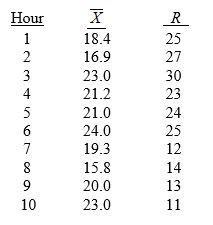
She also decides that lower and upper specification limit for the critical-to-quality variable should be 10 and 30 seconds, respectively.
-Referring to Table 17-4, suppose the supervisor constructs an R chart to see if the variability in collection times is in-control. What is the center line of this R chart?
A) 20.00
B) 20.56
C) 20.40
D) 24.00
Correct Answer:

Verified
Correct Answer:
Verified
Q42: Variation signaled by individual fluctuations or patterns
Q103: TABLE 17-3<br>A quality control analyst for a
Q104: TABLE 17-6<br>The maker of a packaged candy
Q105: TABLE 17-8<br>Recently, a university switched to a
Q106: TABLE 17-6<br>The maker of a packaged candy
Q109: It is not possible for the <img
Q113: TABLE 17-1<br>A local newspaper has 10 delivery
Q122: The principal focus of the control chart
Q129: The control chart<br>A)focuses on the time dimension
Q148: Which of the following situations suggests a