Multiple Choice
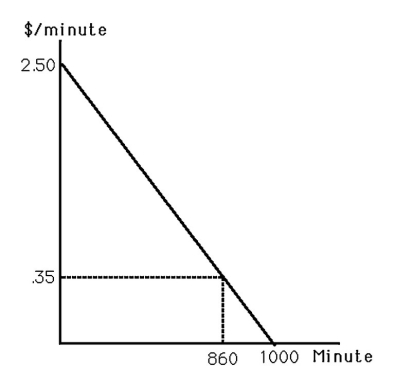
-The above figure shows the market demand curve for mobile telecommunications (time spent on a mobile phone) . If the price were zero, consumer surplus would equal
A) $301.00.
B) $924.50.
C) $1,225.50.
D) $1,250.00.
Correct Answer:

Verified
Correct Answer:
Verified
Related Questions
Q38: The perfectly competitive model makes a lot
Q43: If in a market the last unit
Q49: Consumers seek to maximize<br>A)profits.<br>B)expected consumer surplus.<br>C)expenditures.<br>D)choice.
Q51: Giving presents at Christmas does NOT generate
Q56: In a competitive market,if buyers did not
Q63: Suppose that for each firm in the
Q64: If consumers view the output of any
Q65: What is one reason activists might lobby
Q101: Suppose that for each firm in the
Q155: As the quantity produced of a good