Multiple Choice
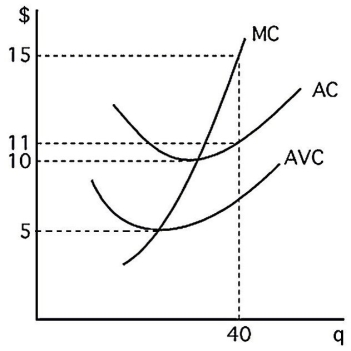
-The above figure shows the cost curves for a competitive firm.If the profit-maximizing level of output is 40,price is equal to
A) $0.
B) $15.
C) $10.
D) $11.
Correct Answer:

Verified
Correct Answer:
Verified
Related Questions
Q13: There are currently N identical firms in
Q14: Suppose that for each firm in the
Q15: A special license is required to operate
Q16: Which of the following markets would reach
Q17: If a competitive firm has to pay
Q19: What is the elasticity of residual supply
Q20: Economists define a market to be competitive
Q21: If a competitive firm's marginal profit is
Q22: If the market price in a competitive
Q23: <img src="https://d2lvgg3v3hfg70.cloudfront.net/TB6808/.jpg" alt=" -The above figure