Multiple Choice
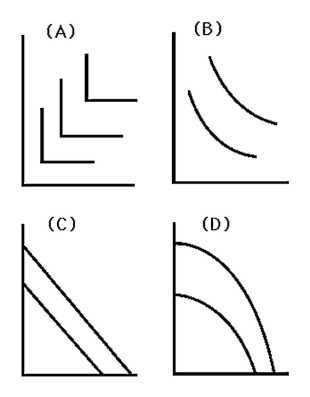
-In the above figure, Graph D with units of capital on the vertical axis and units of labor on the horizontal axis implies that
A) the marginal product of labor is increasing as more labor is employed.
B) the marginal product of labor is decreasing as more labor is employed.
C) the capital and labor are perfect substitutes.
D) capital and labor have to be employed in fixed proportions.
Correct Answer:

Verified
Correct Answer:
Verified
Q11: Which of the following is an example
Q12: <img src="https://d2lvgg3v3hfg70.cloudfront.net/TB8230/.jpg" alt=" -The above table
Q14: All of the following are considered process
Q19: Which of the following statements is TRUE?<br>A)Labor
Q20: A factor of production that can be
Q52: <img src="https://d2lvgg3v3hfg70.cloudfront.net/TB6808/.jpg" alt=" -The above figure
Q53: The slope of an isoquant tells us<br>A)how
Q61: <img src="https://d2lvgg3v3hfg70.cloudfront.net/TB6808/.jpg" alt=" -The above figure
Q87: An isoquant represents levels of capital and
Q109: Joey's lawncutting service recently traded in its