Essay
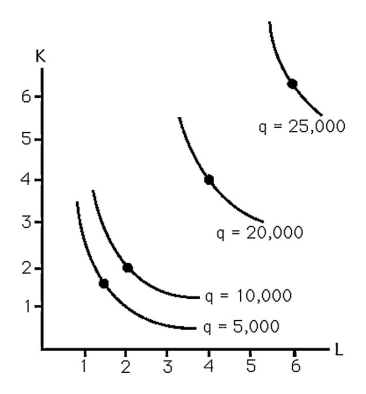
-The above figure shows the isoquants for the production of steel.In which regions of production are there increasing,decreasing,and constant returns to scale?
Correct Answer:

Verified
When output is less than 10,000 tons,the...View Answer
Unlock this answer now
Get Access to more Verified Answers free of charge
Correct Answer:
Verified
View Answer
Unlock this answer now
Get Access to more Verified Answers free of charge
Q47: Consider the following short-run production function: q
Q48: Let the production function be q =
Q49: How much do outputs increase when labor
Q50: Explain why labor might not always be
Q51: Average productivity will fall as long as<br>A)
Q53: Cobb-Douglas production functions can never possess varying
Q54: In the long run,all factors of production
Q55: Decreasing returns to scale may occur as
Q56: <img src="https://d2lvgg3v3hfg70.cloudfront.net/TB6808/.jpg" alt=" -At Joey's Lawncutting
Q57: <img src="https://d2lvgg3v3hfg70.cloudfront.net/TB6808/.jpg" alt=" -The above figure