Multiple Choice
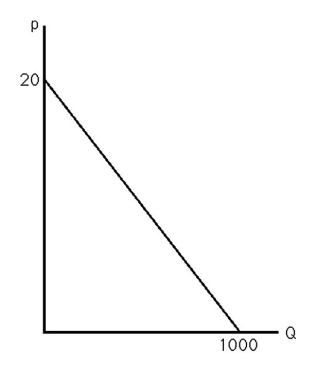
-The above figure shows the demand curve for crude oil.If the market price is $10 a barrel,what is the price elasticity of demand?
A) -.02
B) -1
C) -10
D) -500
Correct Answer:

Verified
Correct Answer:
Verified
Related Questions
Q77: If the supply curve of cigarettes shifts
Q78: The supply curve for tickets for a
Q79: The price elasticity of demand for gasoline
Q80: If the supply curve for orange juice
Q81: If the demand curve for a good
Q83: Because demand curves slope downward according to
Q84: In the mid-1980s,the salaries of accounting professors
Q85: If the price of orange juice rises
Q86: A horizontal demand curve for a good
Q87: As the supply curve shifts to the